PlumeMapper.
Realising the potential of field ambient odour assessment.
Field ambient odour surveys are a highly effective technique for assessing the impact of odour emissions from industrial sources. Ambient odour surveys, or field ‘sniffing’ patrols, have been used in various forms in many countries, including Australia and New Zealand, for several decades. A standardised survey method was first developed in Germany (VDI3940, 1999), and after various amendments to this method in 2006 and 2010, a common European method with new techniques was promulgated in 2016.
Air Environment’s Director, Andrew Balch, has been a pioneer and advocate of the technique since developing the study approach with Terry Schulz in the 1990s.
Andrew sat down with CASANZ Journal's guest editor, to discuss field ambient odour assessments and Air Environment’s new software application, PlumeMapper, designed to handle the complexities of data collection and reporting.
What are field ambient odour surveys?
The technique provides for trained odour assessors to track odour plumes at ground level under varying meteorological and operational conditions to assess the potential odour footprint of one or more sources in real time.
Observed data is collected at multiple locations around an identified odour source (typically downwind), or in the general area where odours are experienced. At each measurement location, a range of observations are recorded including date and time, weather conditions (including wind speed and direction, temperature, relative humidity, pressure, precipitation, and cloud cover), whether or not odour is present, a description of the odour character or the identified source, the strength of the odour experienced in terms of its intensity (according to the German VDI3882 Part 1 6-point scale or the EPA Victoria 3-point scale), hedonic tone (also known as pleasantness / unpleasantness) (according to the German VDI3882 Part 2 9-point scale), and the duration of the odour’s presence. Observations at each measurement location can be made instantaneously or over time (i.e. at a timed interval such as every 10 seconds over a 10 minute period).
Odour assessments typically comprise a dozen or more surveys, with each survey made up of anything from 10 to 50 measurements or more. Often assessments require surveys to be conducted in multiple seasons.
How did you start developing the ambient odour survey technique?
We developed the technique in 1998 when working for the developer that was constructing the athletes’ village for the 2000 Sydney Olympic Games. On completion of the games, the developer planned to sell the village residences, thereby creating the new western Sydney suburb of Newington. However, despite the village only being separated from Sydney Olympic Park, and the Olympic Stadium and Superdome, by a few hundred metres, the largest liquid waste treatment plant in NSW, the Lidcombe Liquid Waste Plant, and the Auburn Waste Management Centre (a waste transfer station), were situated directly between the two key Olympic facilities, and both were generating odours that were impacting the village. We did a few odour studies of the liquid waste plant, including dynamic olfactometry analysis, but the developer asked us to assess the actual impact they were experiencing at the site during construction.
My manager, Terry Schulz, suggested that we just travel around the Olympic Park and athletes’ village site and record our odour observations and some wind data. I ended up getting a bike and cycling around the village construction site for three or more hours at a time, four days a week for six months. I had a field desk with paper forms to fill out, a compass and a hot wire anemometer to measure wind velocity and temperature. When the village was completed just before the Games began, I had to do another three months of surveys.
The project allowed us to fine tune the method and collect an enormous amount of data. We were doing the instantaneous measurement technique, constantly moving positions and taking measurements to track the plumes and map the ground level footprint. There were stack and fugitive ground level odour sources and the plumes often overlapped. I did develop fixed measurement points across the area and would return to the points each survey if within the plumes. The client thought the technique, and the data we reported, was wonderful.
We started the project before the original German VDI3940 standard was released. We only learned of the VDI method when doing field odour survey work with Robin Ormerod in about 2001 around the Stuart Oil Shale Plant near Gladstone. For that project we started using the timed measurement technique, but I remember Robin wanting to use 30 minute measurements in each location to evaluate his dispersion modelling and better understand the plume peak to mean concentrations. This meant each measurement was a lot more time consuming and we could not cover as much of the affected area during each survey. We ended up having multiple teams of assessors in the field including Queensland EPA officers.
You must have collected so much data? And the data is so complex. How did you process it all?
Yes, all the data was collected on specially designed paper forms. And this was long before Google Earth. I did not even have a GPS. I used to photocopy a street directory or topographic maps to take into the field to work out the measurement locations. Then the survey data forms had to be transcribed into a spreadsheet or word processor for reporting.
For the Olympic Village project, I developed the colour coded map reports you commonly see in most field odour assessment reports today. However, we did not have any software to do it digitally. For those reports, I photocopied and enlarged the street directory maps of the area and hand drew, with coloured marker pens, all the survey measurement data on the maps for each survey, then colour photocopied the maps for multiple hard copies of the report. It took a huge amount of time to prepare each survey’s results and a final report. Over time, I started using different software to display the data, but it still took multiple software programs and techniques to collect, analyse and present the data. I know that many field odour assessors are still using paper forms.
Due to the complexities and time-consuming nature of analysing the data, field surveys have typically only been analysed and reported on a survey by survey basis. Connections across surveys, seasons and measurement conditions are rarely made with any depth or detailed analysis, and it is difficult to tease out any trends. This has long been an issue that I have wanted to resolve because the technique is very powerful.
You cannot have assessors in the field all the time conducting surveys. Detailed analysis of air quality instrument data is conducted all the time. How do field odour surveys compare to monitoring air quality with stationary, sensor-based instruments?
Sensor-based instruments measuring odorous emissions such as hydrogen sulfide, ammonia, volatile organic compounds and other odorous compounds can work and we have used them, but they have their deficiencies and are not the silver bullet to odour assessment and management that some practitioners will have you believe.
Their main drawback is that they are not a substitute for the human nose. They do not detect odours at the low concentrations that humans can detect and cannot describe or characterise the odour. Each compound measured is just a marker for the overall odour which can comprise many critical compounds. I do acknowledge that this technology is improving all the time and it is a very exciting field of research that we are following with interest.
While these instruments can record and report data continuously in real time at short intervals, the instruments are in fixed locations. Odour plumes move constantly, and their characteristics can change quickly. This is often due to a range of site activity, emission source, meteorological and geophysical dynamics. These effects are evident when performing field odour surveys. We must continually shift positions to follow the odour plume, which the monitor cannot do.
We have conducted many ambient odour survey projects for industrial facilities that have continuous odour monitoring instruments. We have conducted them because the instruments do not answer the critical questions being asked by managers and the regulators. They cannot chase the plume. They cannot detect the low odour concentrations, at short intervals, and at large distances away, where sensitive receptors are making complaints. And, most importantly, they cannot clearly describe the odours, particularly where multiple industrial facilities have odour emissions with a similar character.
The best scenario is for sensor-based monitoring instruments to be used in support of field ambient odour surveys.
So, for what purpose are field ambient odour surveys typically used?
Ambient odour surveys are used for a variety of purposes such as baseline odour assessments, emissions management, compliance with license conditions and environmental regulations, monitoring the efficacy of odour control and mitigation strategies, assessing odour nuisance, and verifying odour complaints. Surveys are also extremely valuable in evaluating odour dispersion model performance. Furthermore, they can be used in conjunction with odour dispersion modelling to determine odour emission rates from large diffuse sources.
Field surveys are used quite often in New Zealand and in Australia in the last few years have been elevated in status through their designation as a key assessment tool in the new West Australian and Victorian Odour Guidelines. EPA Victoria has promulgated the Guidance for Field Odour Surveillance.
Air Environment has developed a software application called PlumeMapper, designed to collect, store, organise, analyse and report all the field odour data collected during the surveys. Tell me how you developed it?
Collecting and analysing the vast amount of complex data gathered during long survey programs or over many years of compliance monitoring at sites that have to conduct surveys as part of their license conditions has been an issue I have been contemplating for many years.
In 2017, Air Environment conducted an odour sampling and ambient odour survey project at a composting facility in Canberra. We even collected field olfactometer measurements with a Scentroid SM100i Portable Olfactometer. During our long drive back to Brisbane, my colleague, Michael Power and I, discussed the field survey and how we could develop software to assist with the data collection and automation of its analysis. We made detailed notes during the drive and on our return, we set about designing a basic layout for the system.
Later that year, we presented the idea at the Innovation Market at the 2017 CASANZ Conference in Brisbane.
By 2019, we had developed a system for field data collection, analysis, and reporting. We had conducted a one-week field study project of a dozen surveys and a report and developed a range of new analysis and data presentation techniques. However, the technique comprised five independent software tools including a third-party mobile application, Python-scripts, Excel spreadsheets and mapping using Surfer. We had the basis for a new technique and software system, but it was not in an ‘all in one box’ format that could be licensed to end-users. We then began the process of engaging software developers and fully developing the product.
About 18 months ago we began working with various consultants and industry to fully test the product and have been using it on several of our own assessment projects. It culminated in the released to market of PlumeMapper in February this year.
What does PlumeMapper do and how does it work?
PlumeMapper is a mobile and web-based application that facilitates the collection of ambient odour and meteorological information in the field. The data is transmitted to the user’s secure cloud storage account and can be retrieved, organised, and analysed via the web-based software. Analysis comprises mapping and analytics including graphing of various measured parameters.
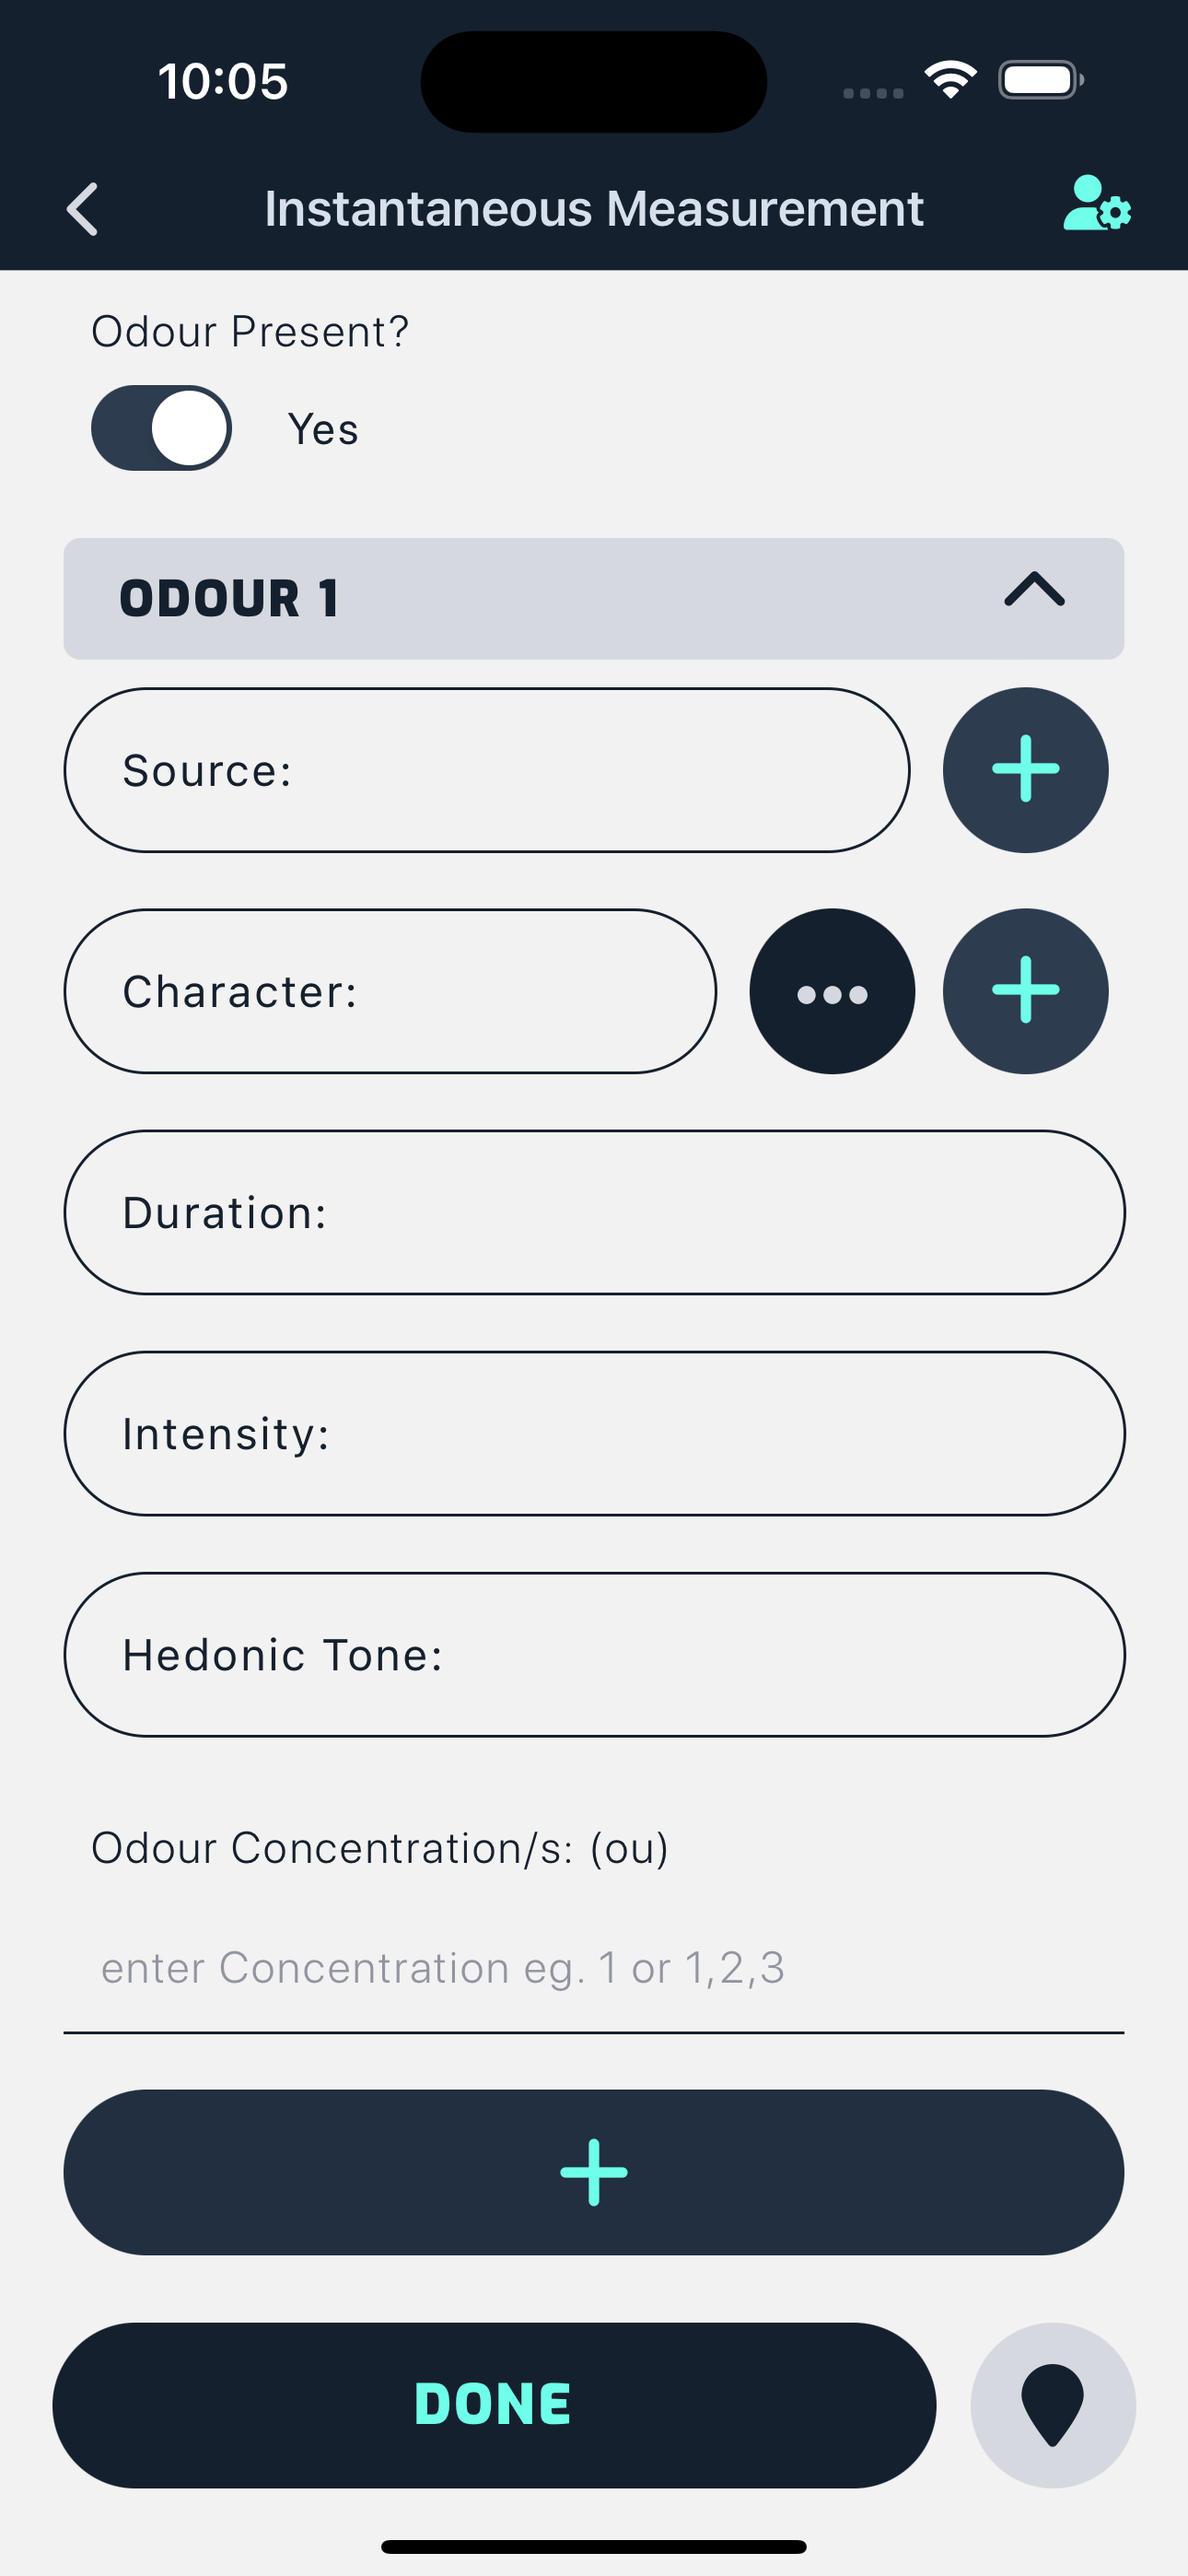
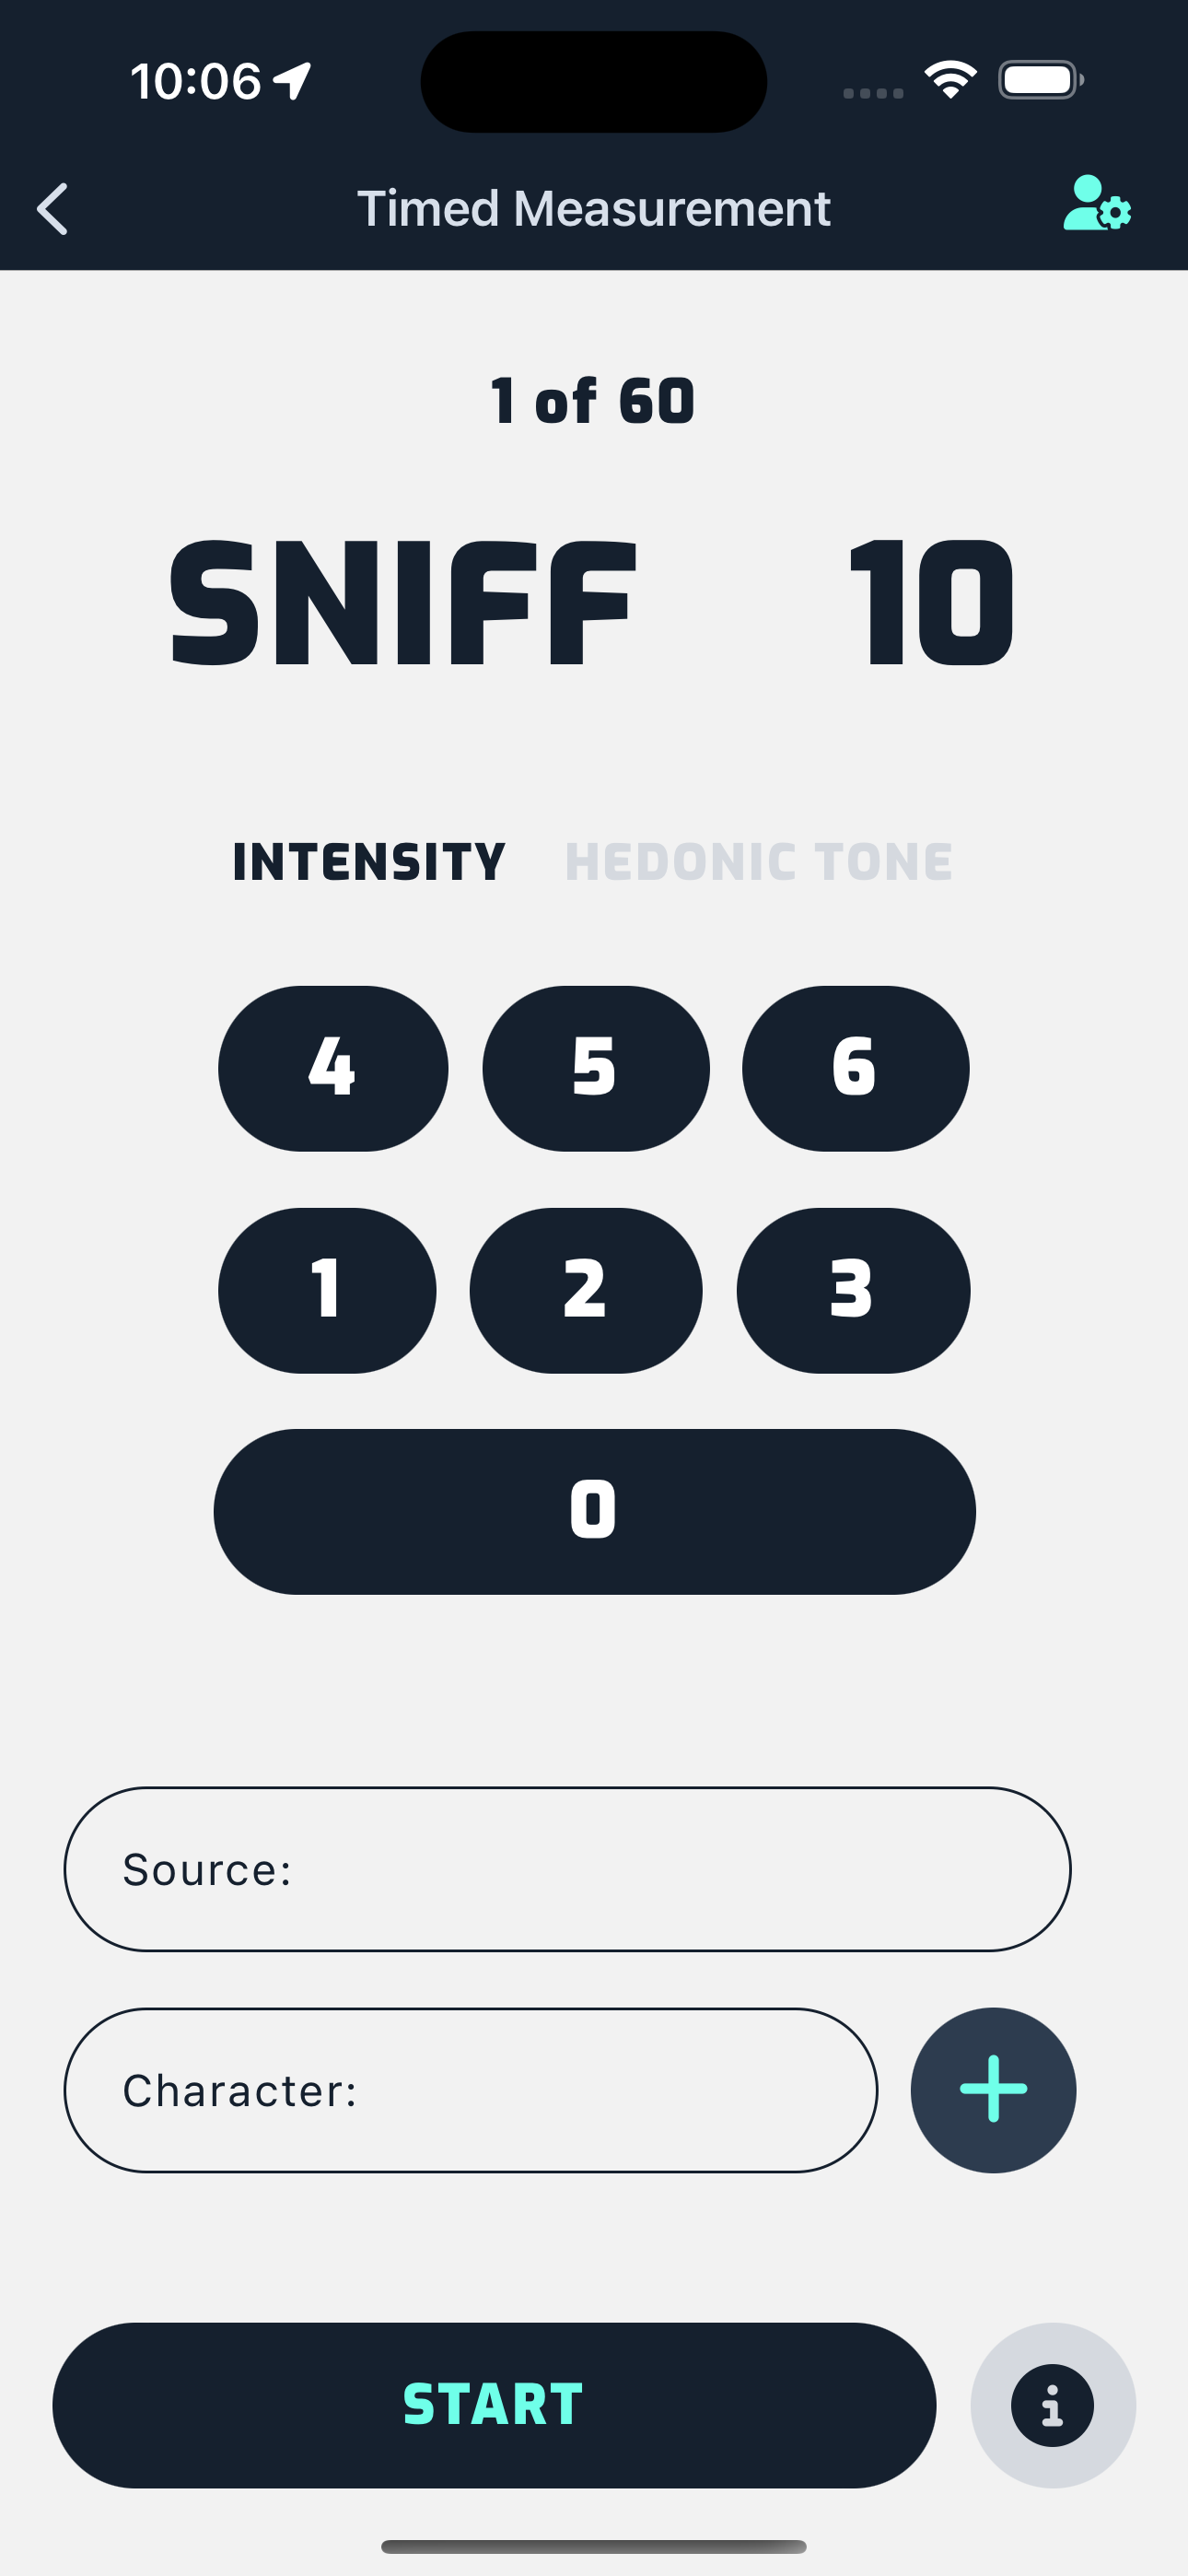
In the field, the mobile application provides for efficient data entry of odour character, source, intensity, and hedonic tone observations. Single instantaneous or timed measurements can be made (see Figure 1). Users can select the duration and sample interval of timed surveys. The application counts down and prompts the user when to sniff and take a measurement. The app is pre-loaded with an odour wheel to assist with character descriptions and supplemental lists of odours can be added on a project-by-project basis.
A full range of meteorological variables can be recorded including wind direction and speed, temperature, relative humidity, pressure, precipitation intensity, and cloud cover and type.
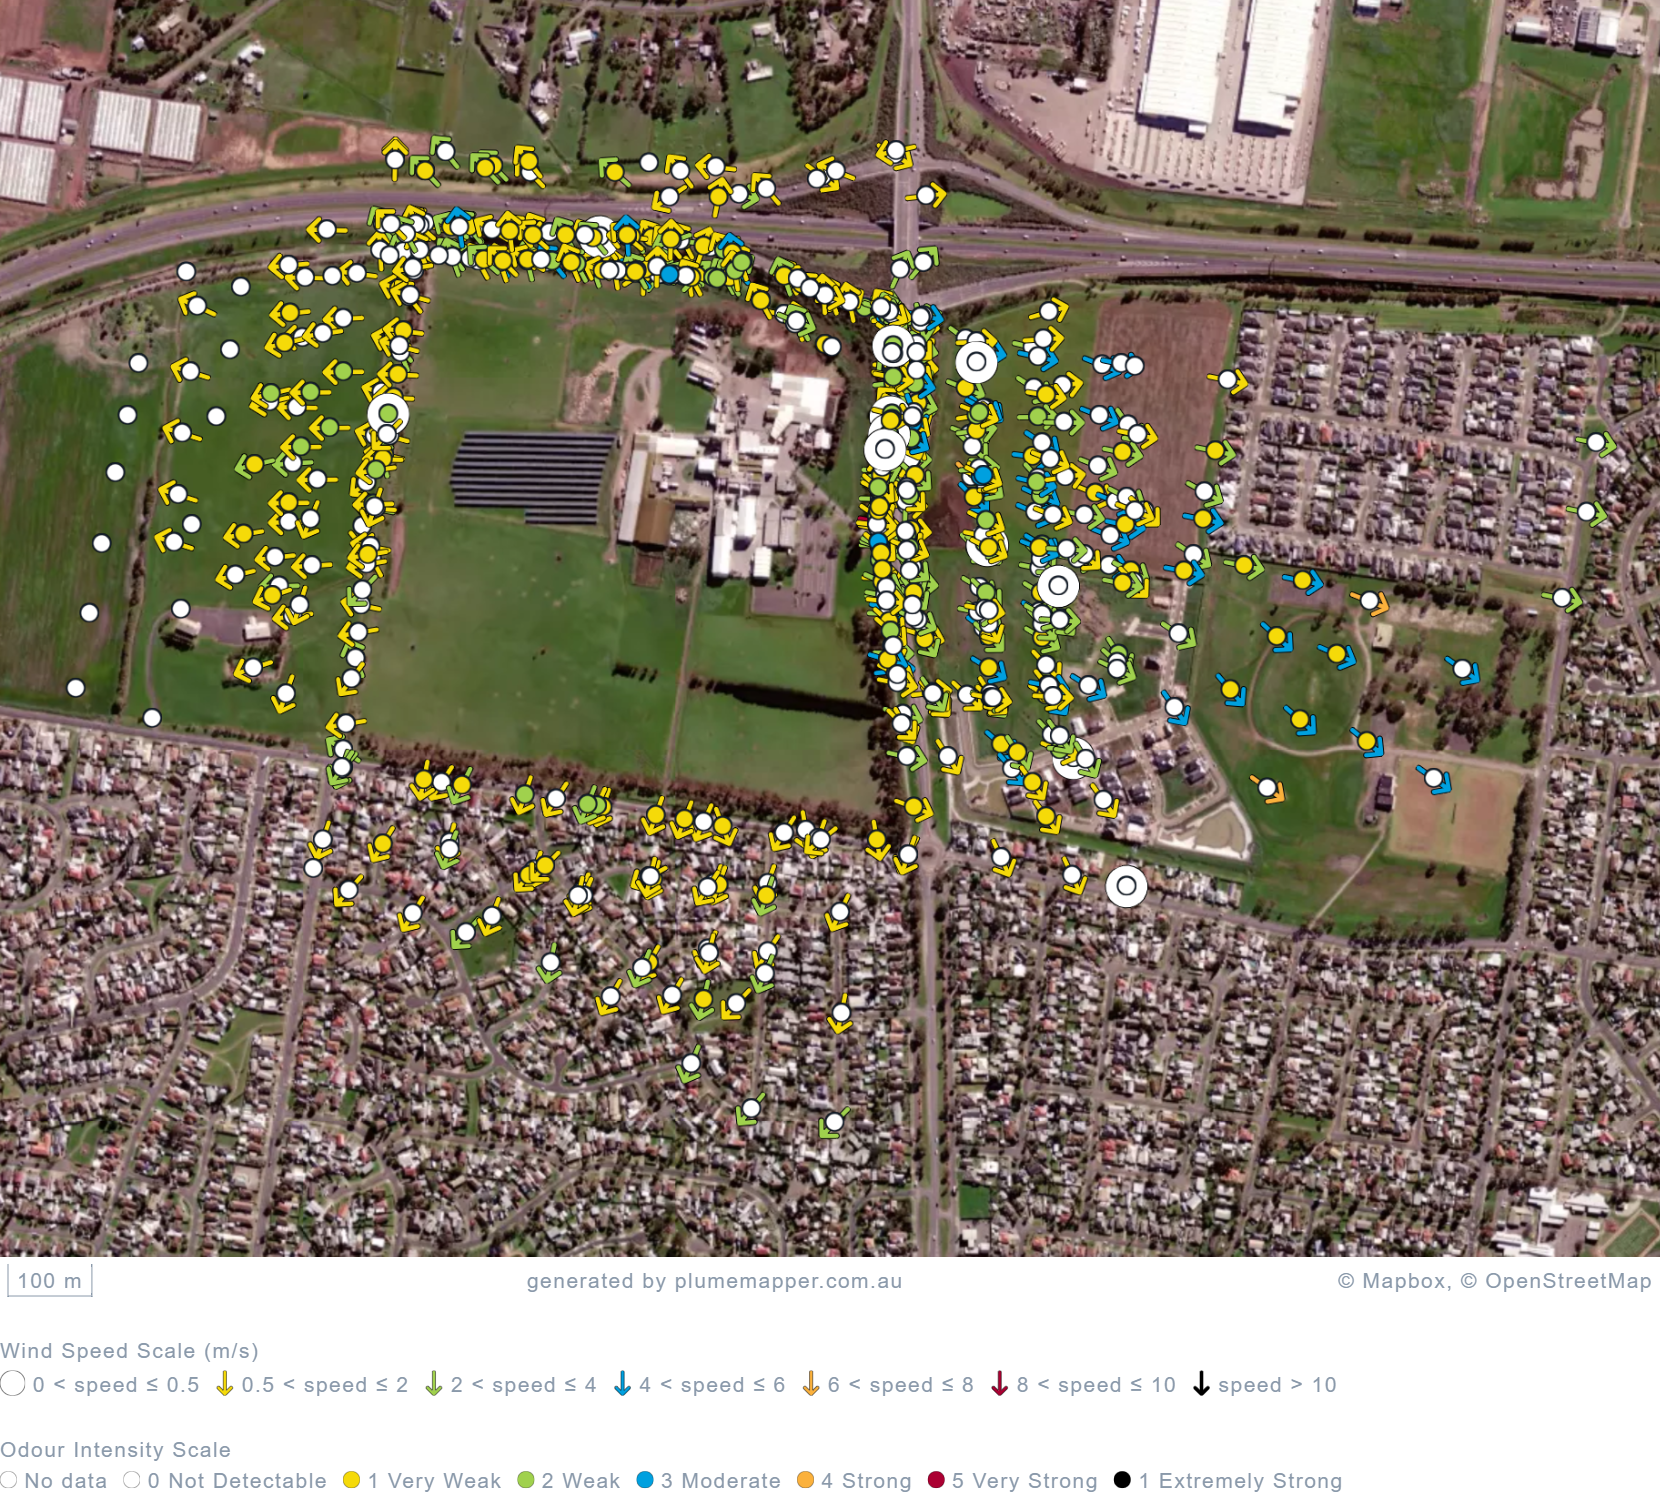
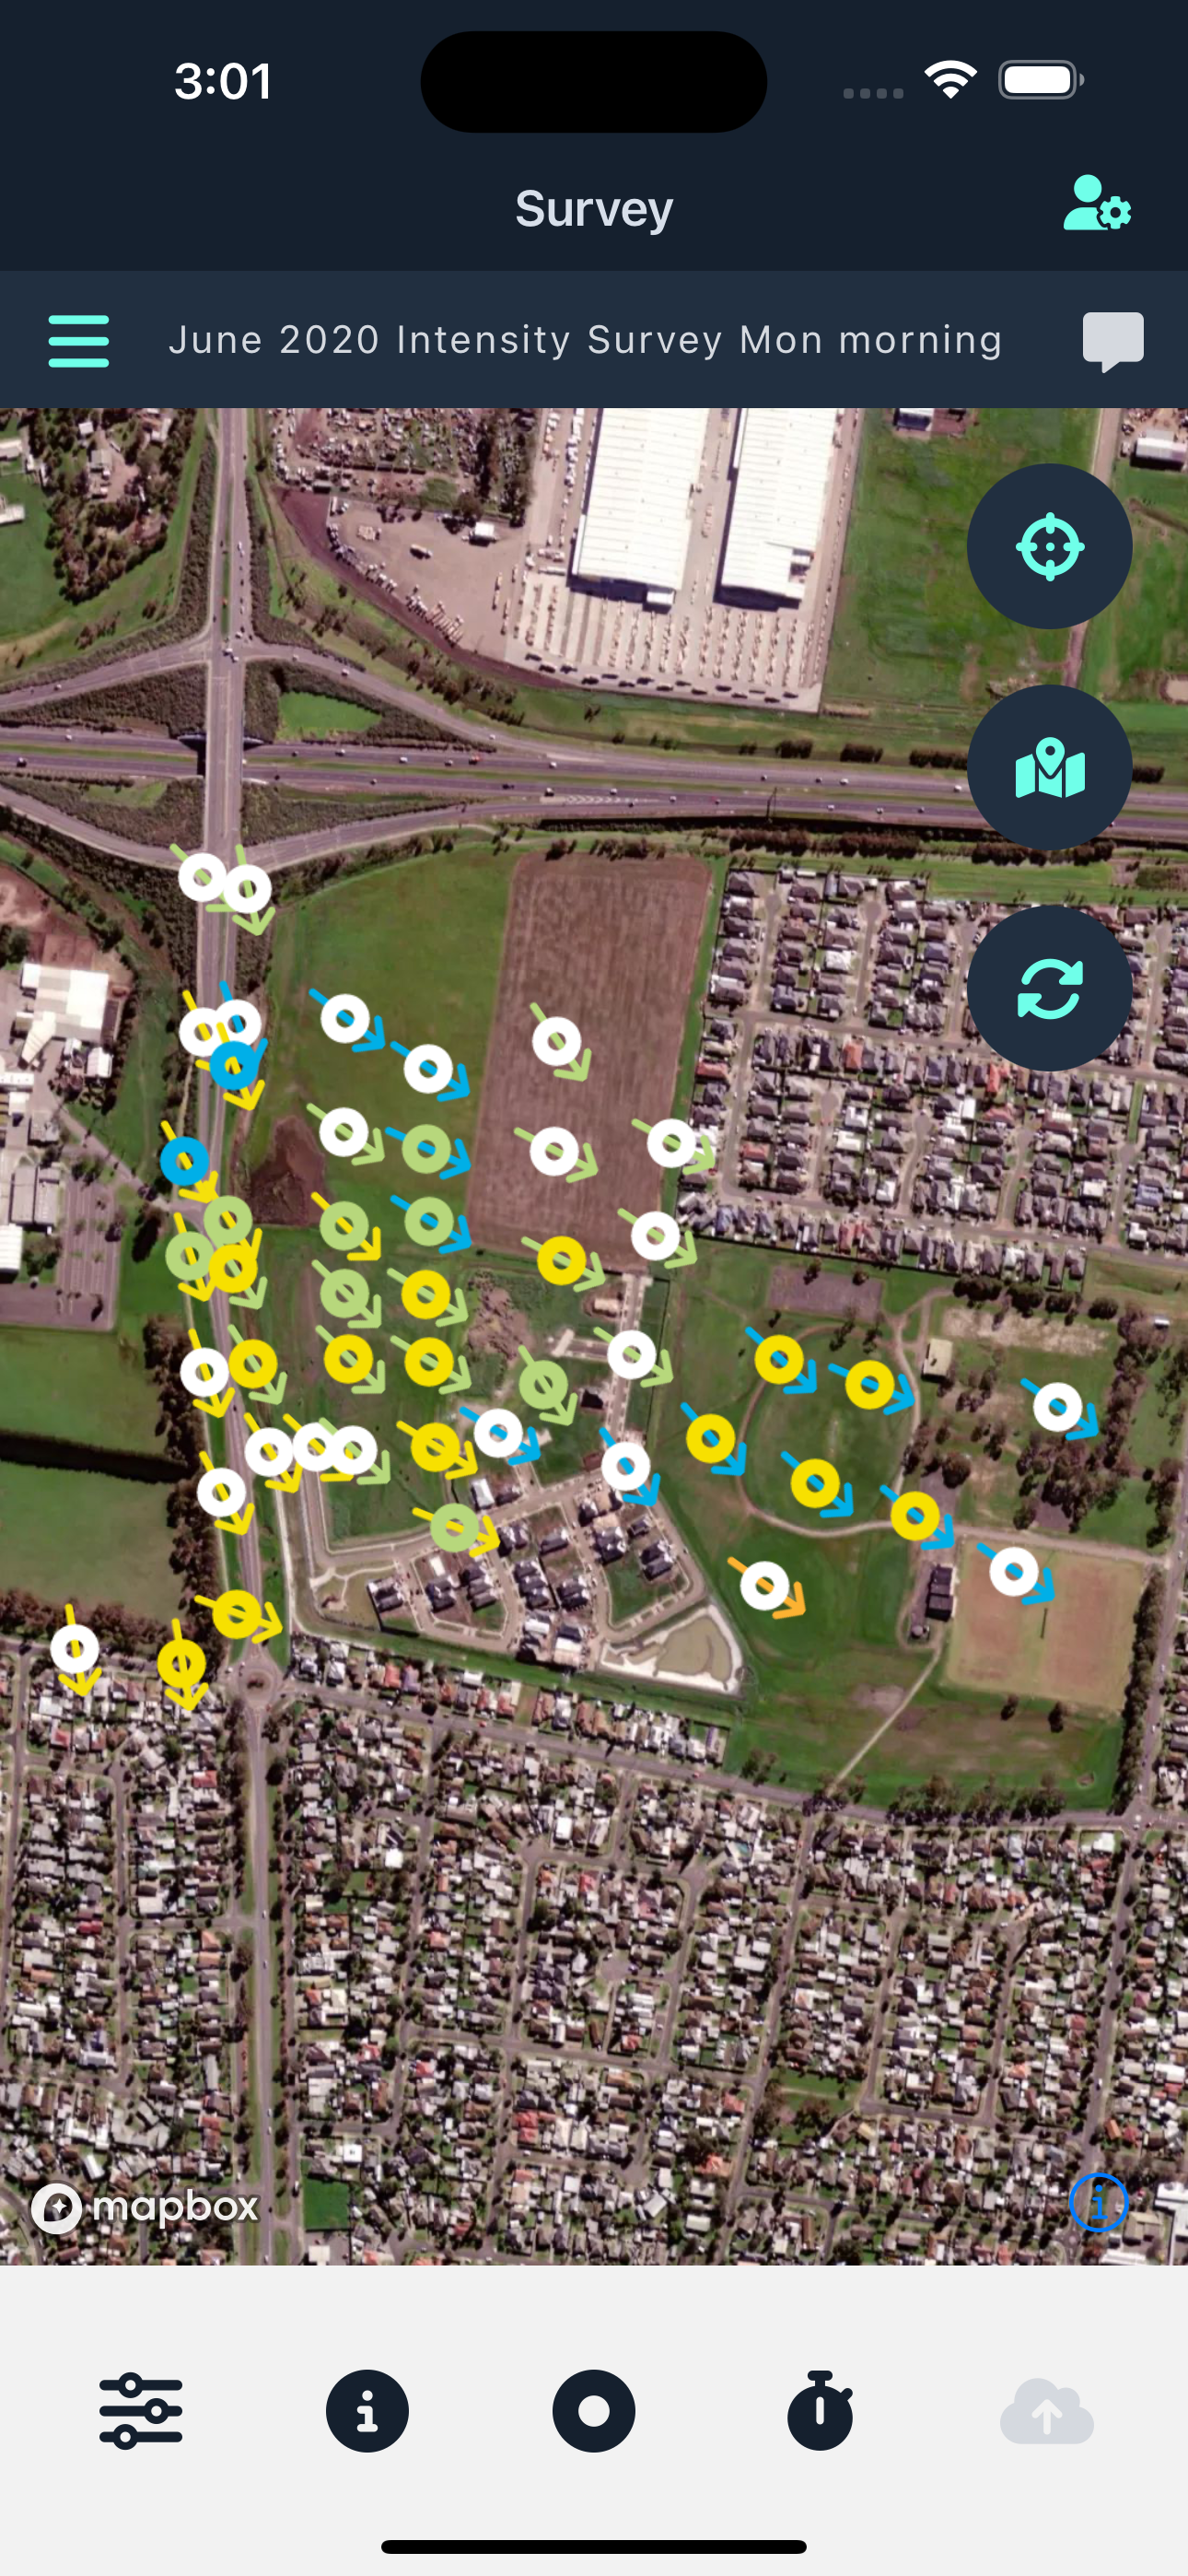
As survey results are recorded, the data is visualised on the mobile device (see Figure 2), with colour coded intensity pins and wind vectors illustrating the plume footprint and wind field. This results presentation assists the user in planning surveys and analysing and reacting to the results in real time.
If the mobile device has internet data access, each measurement’s data is uploaded directly to the user’s cloud account. This allows for another assessor in the field to instantly receive the data on their device and for another person monitoring from their desktop to view the results in real time.
On the desktop, data can be viewed by individual surveys or by all (see Figure 3) or selected groups of surveys. Data can be filtered by any parameter and by multiple parameters such as intensity, hedonic tone, odour source, odour character, or weather variables. For example, you may wish to create a map and statistics for all odour observations of a particular character or source with an intensity of distinct or higher when the wind is greater than 2 m/s. This is easily done, and the resulting map can be exported for a report. You can then compare this map to similar results for winds less than 2 m/s or for a different source under similar conditions.
Other analyses may focus on specific receptor areas. Users can create a receptor zone and extract statistics for all observations in that area. Add conditions to the filters and compare the conditions under which the odours occur in that area.
If available, plot odour complaint data and run statistics on the frequency of complaints. Set up fixed measurement locations in areas of interest or at complaint locations. The fixed measurement points then appear on your mobile device so that you can easily find them in the field during the survey.
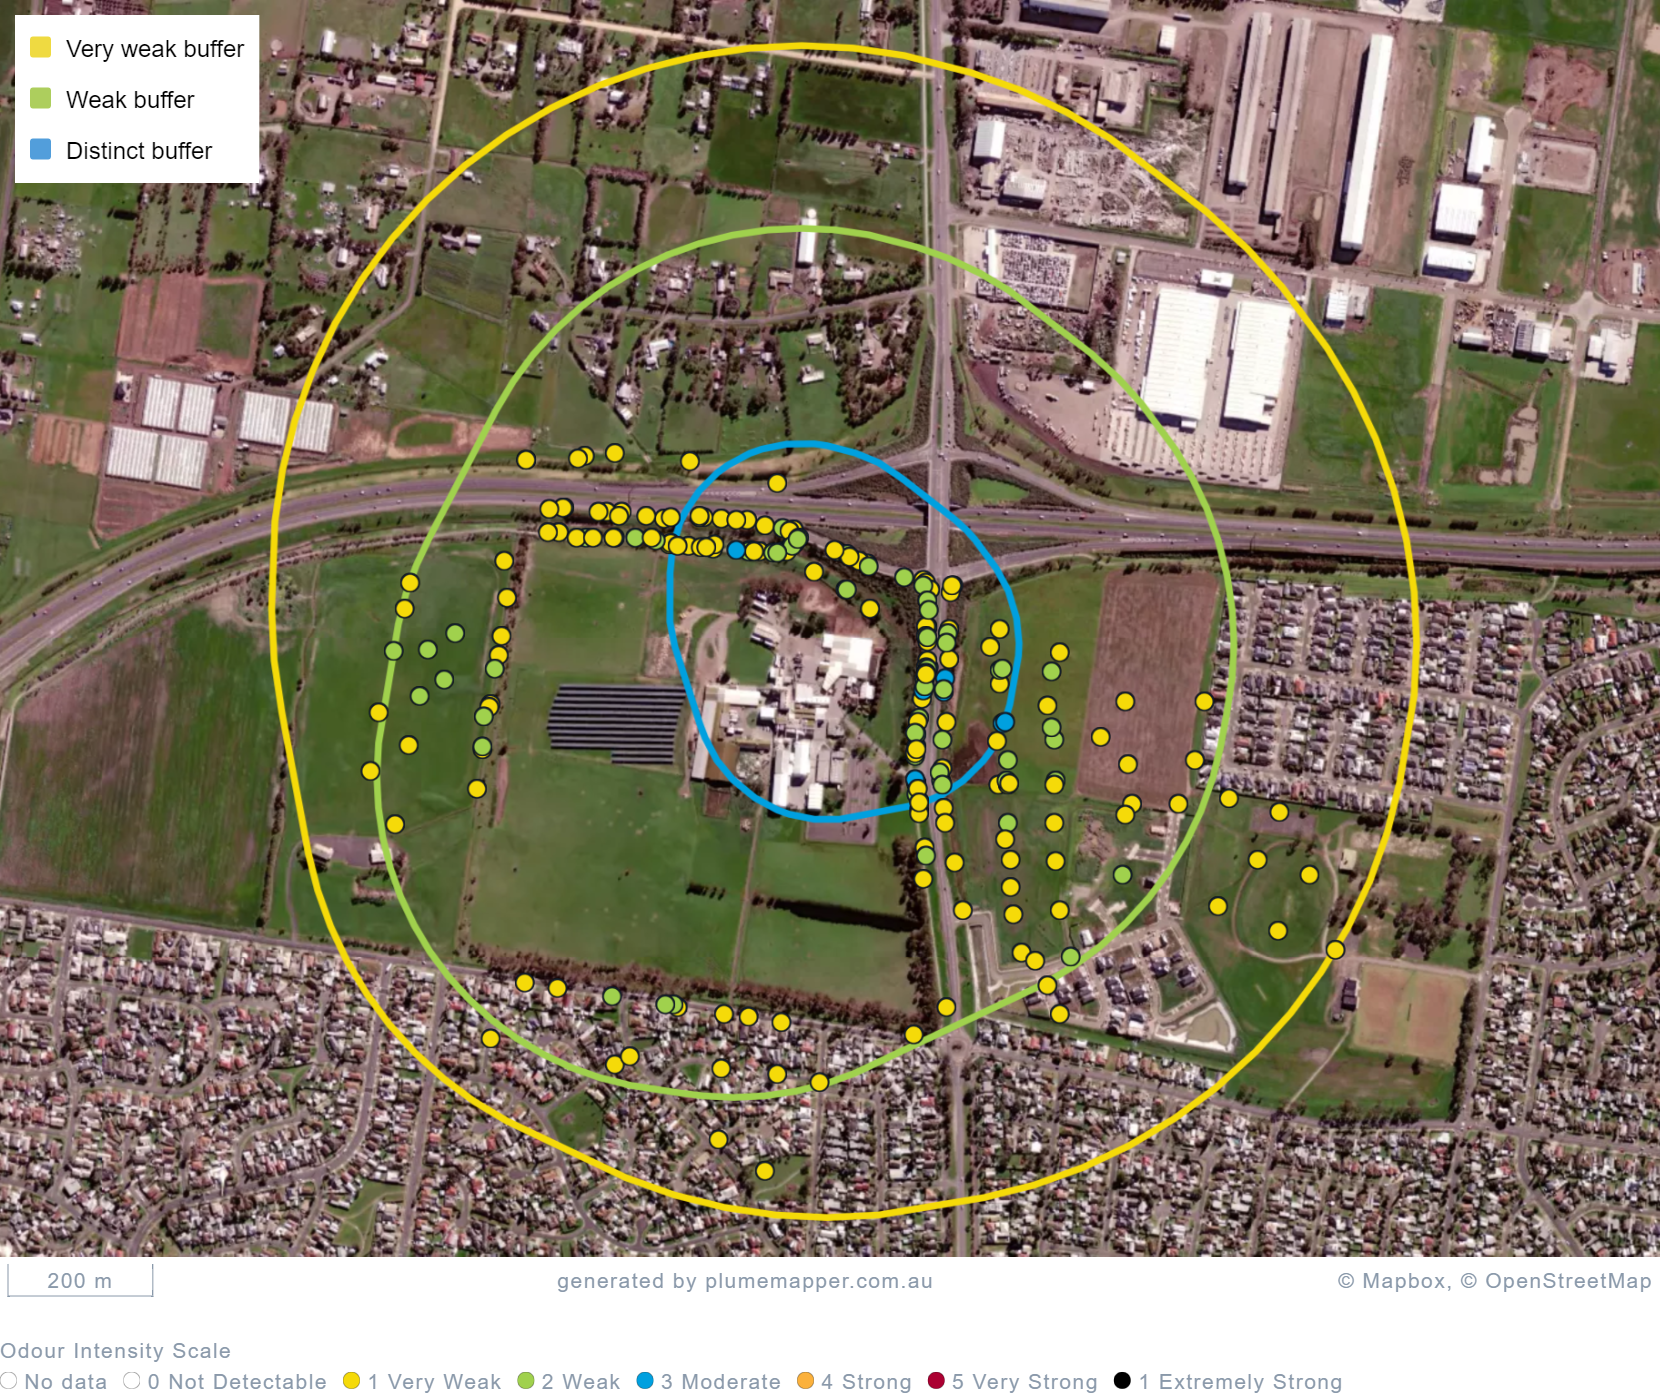
Plot site boundaries and receptor zones and include regulatory separation distances. Use the field data to model actual separation distances for each odour source based on the empirical data you collect in the field (see Figure 4). Compare these to the generic regulatory odour buffers. Maps and charts can be annotated with key details and a legend and exported for direct input into the user’s report.
Survey data can be exported to a CSV file, while data from previous survey work can be imported through a template and import function.
PlumeMapper simplifies the data collection and analysis process, saving you time and money. Preparing maps and charts is instantly done for you. Users no longer have to transcribe data from paper forms. Transcription and data entry errors are eliminated. Editing can be done on the mobile device in the field or on the desktop application. Once you have entered the correct data in the field, you never have to touch it again. An audit log function keeps track of any edits and changes.
Organisations that subscribe to PlumeMapper indicate an administrator, that manages the account and sets up users (odour assessors). Assessors and equipment involved in each project can be managed through the Administration Portal, including setting reminders for assessor and equipment calibration dates.
Which types of organisations would benefit from using PlumeMapper?
We have designed PlumeMapper to benefit all sectors from consultants and researchers, to government regulators such as EPAs and Councils, to industry themselves. We already have clients from each of these sectors using PlumeMapper.
Consultants can use it for multiple clients and multiple client sites. Regulators can use it to register and track complaint data, follow up and verify complaints, track odours from individual facilities or multiple sites within a complex industrial estate. While industry can use it to record complaints and conduct regular site and boundary surveys to ensure odour emissions comply with license conditions. Some businesses have multiple sites across regions. PlumeMapper can be set up for industry to map each site individually or combine the assessment if their sites are close by.
Are you planning any future versions with added features?
Yes, we are currently adding more data analytics and visualisation features like charts and statistics.
In the next version, we are planning to add GIS and GeoJSON support features, which will allow for the importing and exporting of shape files, as well as adding enhanced mapping tools and other data modelling.
Automated, formatted report generation of user data will also be added to further streamline the reporting system.
And one of the most exciting new features we are working on is the import of weather data, its analysis and incorporation into the current analysis suite and its visualisation. This feature will include the import of both real time automatic weather station data, and portable handheld anemometer data, which are commonly used by many field practitioners.
How can people interested in PlumeMapper start using it?
Contact Air Environment and we can provide a demonstration and a free 14-day trial.